Italiano
 English
The Most Common Problem: poor Communication, lack of Sharing Understanding, ineffective Decision Making
When it comes to mapping out a strategy for a new product, service, or organizational structure, we might have experienced meeting madness!
There is excellent literature about this problem out there, with a discrete number of proposed solutions, but rarely a systematic approach to tackle details and the big picture as one.
Moving from meetings to summaries and reports, presenting and engaging in conversations should have only one purpose:
- communicating effectively
- improving the level of mutual understanding
- increasing the effectiveness of decision making as part of a Clear Intention.
Those are all critically important factors to the success of our initiative, to make out an effective strategy, and therefore useful to move a step forward in achieving our desires and hopes.
Communication is an art of expressing information at many different levels, sharing ideas, opinions, or thoughts as well as feelings, but particularly understanding what is expressed by others.
While we have a natural tendency to communicating, the level of communication varies from individual to individual, also depending on the quality of information, background, context, and many other aspects.
It is indeed tricky to communicating effectively. However, Understanding requires on top of this the ability to transfer our knowledge correctly, to establish a common baseline for interpretations and actions; all of those are fundamentally necessary to improve the Decision Making and strategise the near future.
Communication and Collaboration Biases
No matter how exciting and challenging is our strategy, team members have a tendency to discuss information that all members are familiar with. Conversely, to spend less energy talking unshared information in possess of a few, limiting our ability to evaluate multiple scenarios exploring all the options at hand.
We tend to focus on acquiring knowledge, making the assumption that once we have got the knowledge we consequently understand each other. Still, knowledge doesn’t equal understanding, posses the knowledge does not mean I can understand what is going on or what is the real issue.
Information is neurologically addicting, and when a new initiative comes in, there will always be more information to explore and from different angles. Unfortunately, too much data disable our decision making, limiting ourselves to collect data rather than actualise reasonable actions.
Last but not least, we tend to focus only on one thing at a time, then moving to the next one, and very often forget the big picture essential to get the systemic view, understand the underlying systemic principles, and how and where the energy value flows.
Let’s get it undone!
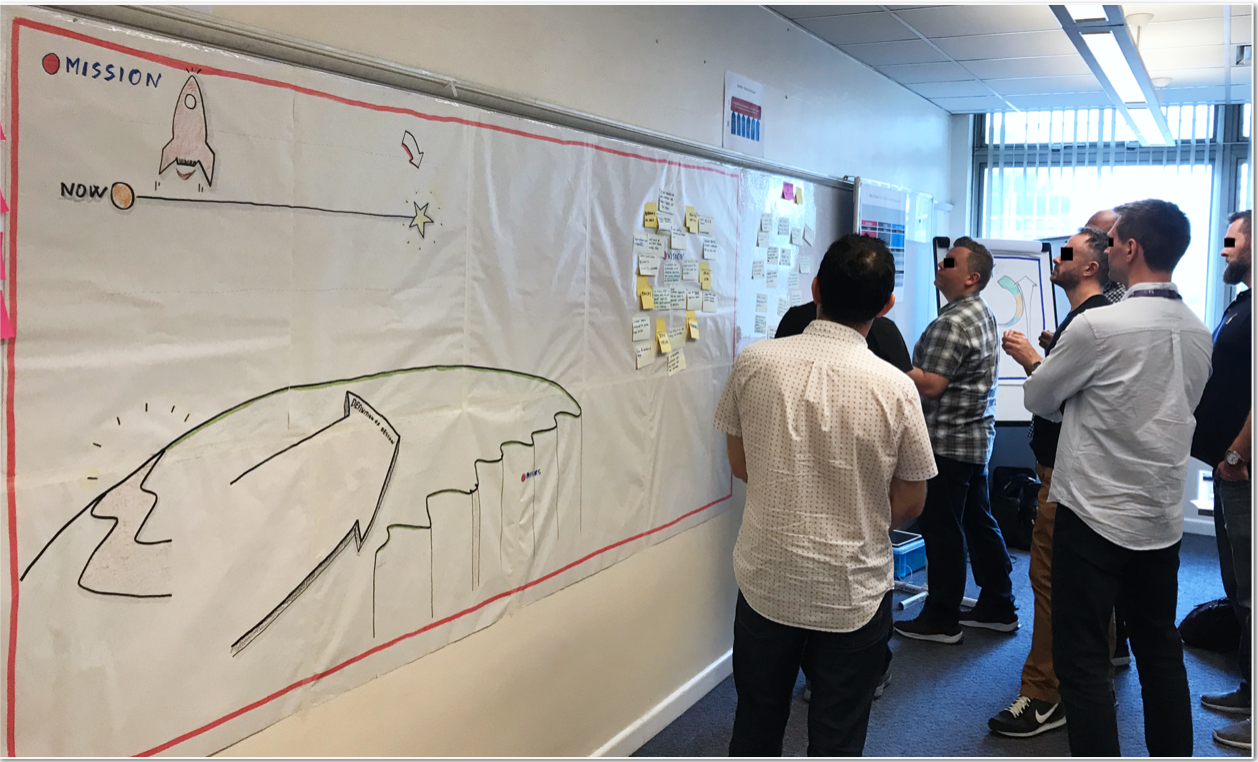
For instance, to improve the level of sharing understanding, most people write information on a large whiteboard using many different structures to organize data and ask to collectively add more and more information, tag and label everything and eventually review the information shared. The whiteboard becomes pregnant of items, sketches, and post-it of different colours; the more, the better, whereas systemic principles like Time, Place, and Exchange remain forgotten, but still behind the system as balancing forces (1).
As a result of those meetings, whiteboards look like an aggregation of a multitude of information, organised and categorised. The majority of the audience will be positively surprised by the new amount of information collected, and somebody feels even relieved by not to share some other information thankfully not in scope, each person will have some individual task to move on. Eventually, everyone is ok, and the meeting comes to an end.
Is this useful? Does walking around in a circle to collect more information will help our team to strategise the future? Where is the living story about our compelling initiative, what kind of feelings, thoughts, and movements representing secret truths hidden behind the silence or tons of words!
Increase the success plans by illuminating the system with Visual Storytelling!
Adequate words, even bold written, will resonate for a while, can motivate and provide us with the right answers at the time, but sooner or later, this will be not enough. By the time goes by, we naturally tend to lose pieces, details and also struggle in wrapping up the narrative when it is needed. Here is when a clear picture comes into help to refresh memories and summarises connections at a snap more than any sentence, facilitating the sharing understanding and provide options for further explorations.
When pictures and maps melt organically along the timeline, the feedback provided by each key representative of the system explored enables tacit assumptions to be turned into explicit information, allowing for more precise insights and revelations. Visual Storytelling Mapping enhances strategic inquiries by making the abstract concrete, by illuminating relationships between elements, and by simplifying complex ideas, it is, after all, a living representation of our system. Visualising the big picture will be useful for finding solutions that serve everyone.
There is nothing against any traditional approach to simplify or item the work adopting any possible technique to categorize information, and this would be helpful at the time. Still, Visual Story Telling Mapping tends to be useful more than necessary, dislocating the essential element of the system observed, drawing the timeline so that every single element can find its place of belonging, living space for any representation to make the system more transparent and provide at the end the big picture of it.
Visual Storytelling Mapping
It is time now to move forward, exploring the land of Visual Storytelling Mapping!
For the purpose of this article, I am going to:
- introduce the general traits of my Visual Storytelling technique
- wrap up the big picture introducing the Agile Future Canvas.
Let’s dive into it!
The Benefits of Visual Storytelling
A visual story map stands like a dot of thoughts travelling a surface, simple patterns that come to life and begin the process of information visualisation, which in turn creates simple connections between the available dots, making it easier to identify the narration across its elements. A Visual Story Map simplifies the data and shares the crux to everyone, and it harnesses the power of maps to tell the story in the most conducive and natural way.
Plot your strategic themes
Storytelling becomes purposeful when elevating the narration above the mere sequence of events. Although it is possible to tell a story without planning out anything, a plot allows arranging a series of events to reveal strategic themes and the impact of the emotional significance of its elements. Strategic themes act as a logical group of features and behaviours. Hence, each plot primarily organizes all events in recognizable patterns so to make it easy to understand the expected outcome in each one. Furthermore, layering plots give us the flexibility to include additional exploratory levels so to make the story flexible enough to rewrite the entire narrative as necessary.
Defining strategic themes provides structure and direction to the story, without which any plot is only a general idea; hence it is essential to identify what are the Strategic Themes why the story exists.
Here some example of a possible strategic theme:
- Customer satisfaction, product challenges, technology update, disruptive innovation, competition, sustainability, prosperity, lower costs.
A story comes of many plots, each one different in terms of purpose and objective but equally important when it comes to adding details at different levels, and plots are about how the story evolves. Each plot plays out while another priority can intrude and fit in a complication at any time; this is why have a clear understanding of each different plot might improve to identify interrelated dependency. Different layers bring to different light flavours flooding our minds of inspected insights.
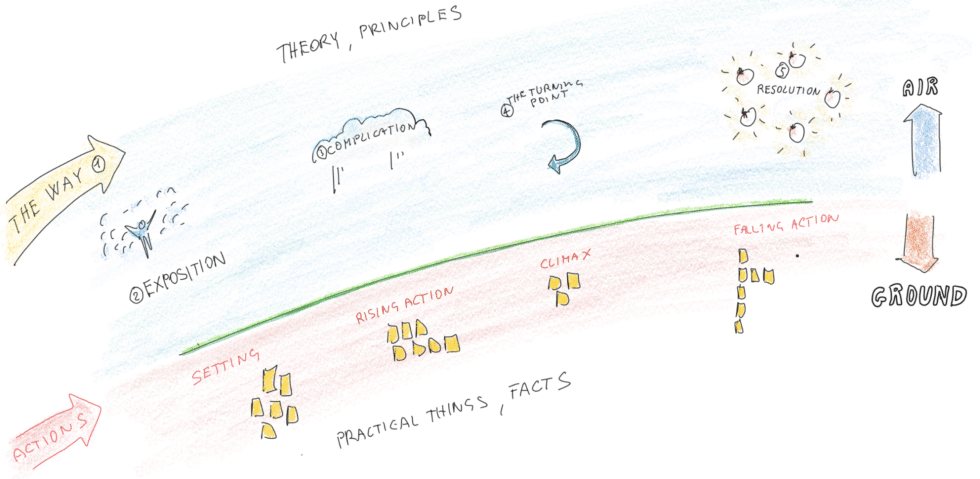
You can divide the storytelling into five main plots on the upper narration layer (The way, Exposition, Complication, Turning Point, Resolution) and free space so to explicitly declare the strategic theme and any direct implication in terms of connections.
Narration Layers & Graphics Elements
The narrative visual mapping plays a fundamental role in the information visualisation process. To make it valid, it requires to overlay a few simple but essential steps one after another:
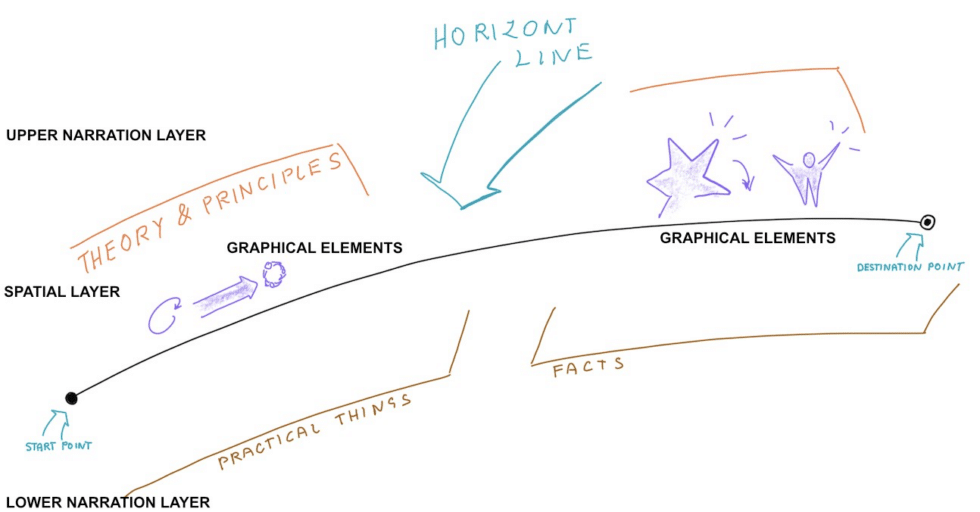
The definition of spatial layers where the upcoming narrative will take place
- To start, draw a line representing the domain horizon. This line represents the event horizon depending on the context explored, could comprise an initial point and an ultimate destination, but also different perspective points. The horizon line is just the beginning of where your idea and information will take place according to each plot respecting the Systemic Time principle, recognizing which element came first and a logical timeline. The narrative will usually take place on two different levels: Above the surface stands the upper narration layer, were principles and theory find their place describing with emotions (colours and pictures) a sequence of events according to each plot. Below the surface, the narrative upholds by a series of intents, actions, and facts useful to support the story and the journey theme. Perhaps, both can take place on each side or use the available space to exploit the context of the narration, both areas show different states, conditions, and visibility of the setting. A narration line to adequately explain how the information relates to each other.
Graphical elements with their properties to draw our attention to
- The primary graphic elements are points, arrows, curves, and any possible combination of those. Graphics elements behave like ingredients for a recipe. For our purpose, they spice the canvas adding information and convey visual messages. Next step to position more symbols, icons, particular and unique elements on the storyline as representatives of the system, one at the time, starting with two and moving forward, as the situation unfolds our mind until we collectively feel that is enough.
Make The Big Picture stand out with these three canvases: Visual Future – Purpose Tree – Purpose Canvas
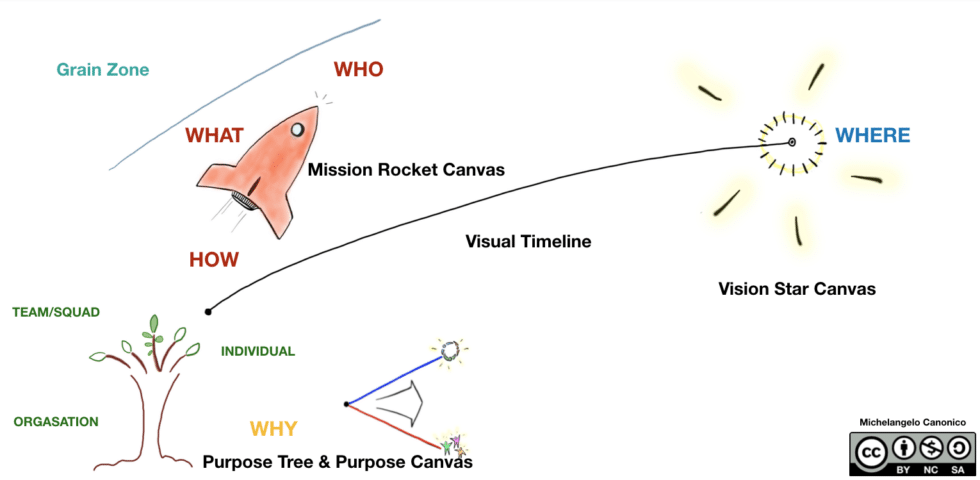
Agile Future Canvas is comprehensive multi-layer storytelling map, useful to clarify the big picture of our next challenge, highlight what drives us and our intent. It allows to place Purpose, Vision and Mission statements in the correct order, each one decorated with just enough details to clarify initial motivations and points of decision. It allows the team to put objectives and actions across the horizon-line, which in turn will trigger further ideas. In the end, the big picture will stand out, improving the sharing understanding and clarifying and inspiring the team for further actions.
Once we have stick all the statements on the board we can finally move onto the refinement process:
- Put the light on each sentence and visualise what is meaningful mapping all concepts and information and explore the options available. Mainly the Mission Rocket Canvas leave space for essential elements: What we are going to do, for whom, and how we intend to accomplish our mission. Furthermore, the Grain Zone will host what we are not allowed to do, for now, uncharted territory, lands for further explorations.
- Exploit the role of representatives asking each participant in turn to provide feelings and valuable sentences, useful to help the system to move forward. The new information will stick to the place where they belong, enriching the map with fresh new elements, and clarifying the storytelling.
References
(1) Constellations allow an inner alignment with the natural organising principles which sustain the human condition at work, in life. Time, Place and Exchange are the organising principles of systems. Learn more about Business Constellations.